关于ESRI Flex API的Symbol
|
转至:http://www.voidcn.com/article/p-wvktutuc-mg.html 关于ESRI Flex API的Symbol ???????? Symbol是用来在地图上重新显示地理图元渲染方式的类库。(Symbols are used to represent "geometries" on the map),在实际应用中非常重要,使用好看的样式,无疑可以为你的系统增添很多的亮点,当然客户看着也很舒服。 ??????? 查看官方帮助文档中的介绍,我们可以看到关于Symbol的介绍。首先列举如下: ??????
??
样式概述:
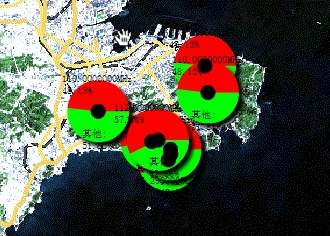
? ?? ?API中的Symbol可以分为以下几种: CompositeSymbol(组合样式):包括CompositeSymbol MarkerSymbol(点样式):包括SimpleMarkerSymbol和PictureMarkerSymbol FillSymbol(面样式):包括SimpleFillSymbol和PictureFillSymbol LineSymbol(线样式):包括SimpleLineSymbol和CartographicLineSymbol InfoSymbol(信息样式):包括InfoSymbol一种 TextSymbol(标注样式):包括TextSymbol一种 ? 以下介绍对几种样式做简单介绍 1、 CompositeSymbol:用于将多个样式进行复合起来。使用方法如下: ? <esri:CompositeSymbol>???????????????? ???????<esri:SimpleMarkerSymbol style="circle" color="0x0000FF" size="20"/>??????????????????????? <esri:TextSymbol text="i" color="0xFFFFFF" backgroundColor="0x0000FF">??????????????????????????? <flash:TextFormat bold="true" size="16"/>??????????????????????? </esri:TextSymbol> </esri:CompositeSymbol> ? 上述代码的效果就是在圆里面写个字母i。详细见ESRI官方在线例子。 ? 这个效果可以用来进行标注的渲染,使标注多样化。 ? ? 2、 SimpleMarkerSymbol:指定预先定义好的一些marker,来渲染地图图元。 ESRi提供的样式有以下几种: public static const STYLE_CIRCLE:String = "circle" ---圆形 public static const STYLE_CROSS:String = "cross" ----十字叉 public static const STYLE_DIAMOND:String = "diamond" –菱形 public static const STYLE_SQUARE:String = "square" ---矩形框 public static const STYLE_TRIANGLE:String = "triangle" ---三角形 public static const STYLE_X:String = "x" ----x形叉 ? 3、 PictureMarkerSymbol:使用一张图片定义样式。这是最常用的渲染方式之一。 我们通常的应用都会使用这一样式,使地图图元的意义更加明朗,地图也更加的美观。 使用AS的定义方法为: PictureMarkerSymbol(source:Object = null,width:Number = 0,height:Number = 0,xoffset:Number = 0,yoffset:Number = 0,angle:Number = 0) Source:图片路径,可以为网络路径或本地地址 Width:图片宽度。Height:图片高度。Xoffset:x方向上的偏移。 Angle:图片的旋转角度。 例如: Var graphicPointSym: PictureMarkerSymbol = new PictureMarkerSymbol(widgetIcon,30,30); ? 其中的值都是有默认值的 4、? SimpleFillSymbol:用于对多边形类型的gra进行样式填充。需要使用SimpleLineSymbol设置边界的样式。 5、? PictureFillSymbol:使用图片对多边形进行填充 6、? SimpleLineSymbol:线的简单样式。在此不做介绍 7、? InfoSymbol:功能相当强大,其可以嵌入flex的控件进行渲染,例如饼图等都可以完成。用好此样式可以使自己的系统功能强大,事半功倍。 下面介绍一个为每个gra绘制饼图的例子。 按照如下方法定义一个infosymbol ?????? <esri:InfoSymbol id="PointSym" infoPlacement="center"> ????????? <esri:infoRenderer> ????????????? <mx:Component> ????????????????? <mx:VBox width="100%" height="100%"> ?????????????????? <mx:PieChart id="pieChart" dataProvider="{data}" width="90" height="90" showDataTips="true"> ??????????????????? <mx:series> ??????????????????? <mx:PieSeries field="num" labelField="name"> ?????????????????????? <mx:fills>? ??????????????????????????? <mx:Array>? ??????????????????????????????? <mx:RadialGradient>? ??????????????????????????????????? <mx:entries>? ??????????????????????????????????????? <mx:Array>? ?????????????????????????????????????????? <mx:GradientEntry color="#FF0000" ratio="0"/> ??????????????????????????????????????? </mx:Array>? ??????????????????????????????????? </mx:entries>? ??????????????????????????????? </mx:RadialGradient> ??????????????????????????????? <mx:RadialGradient>? ??????????????????????????????????? <mx:entries> ??????????????????????????????????????? <mx:Array>? ?????????????????????????????????????????? <mx:GradientEntry color="#00ff00" ratio="0"/> ??? ????????????????????????????????????</mx:Array>? ??????????????????????????????????? </mx:entries>? ??????????????????????????????? </mx:RadialGradient> ??????????????????????????? </mx:Array>? ??????????????????????? </mx:fills>????????????? ???????????????????? </mx:PieSeries> ?????????????????????? </mx:series> ????????????????? </mx:PieChart> ???????????????? </mx:VBox> ??????????? </mx:Component> ??????? </esri:infoRenderer> </esri:InfoSymbol> ? ? 将此样式赋给要显示饼图的gra,注意PieChart的dataprivide为{data}这是固定写法,使用之可以将gra的attribute的信息内容赋给data。也就是说: Dataprivide=data=gra.attribute; 下面的结构是data的定义: ? var GraInfo:Object= { ? num:CurrentPec,?????????????? ??? ??????name:gra.attributes.FREQ_LC+"MHz:/n"+CurrentPec+"%" }; 将num值赋予饼图当做饼图的值,name值当做鼠标移上的提示。 至此就可以完成一个infosymbol的使用。效果还是比较好的。 ? ? ? 注意:复杂的样式占资源很厉害。绘制很多点和面时请斟酌下。一般图片样式超过300个点用户体验就好了 (编辑:李大同) 【声明】本站内容均来自网络,其相关言论仅代表作者个人观点,不代表本站立场。若无意侵犯到您的权利,请及时与联系站长删除相关内容! |